Prediction through linear relationships
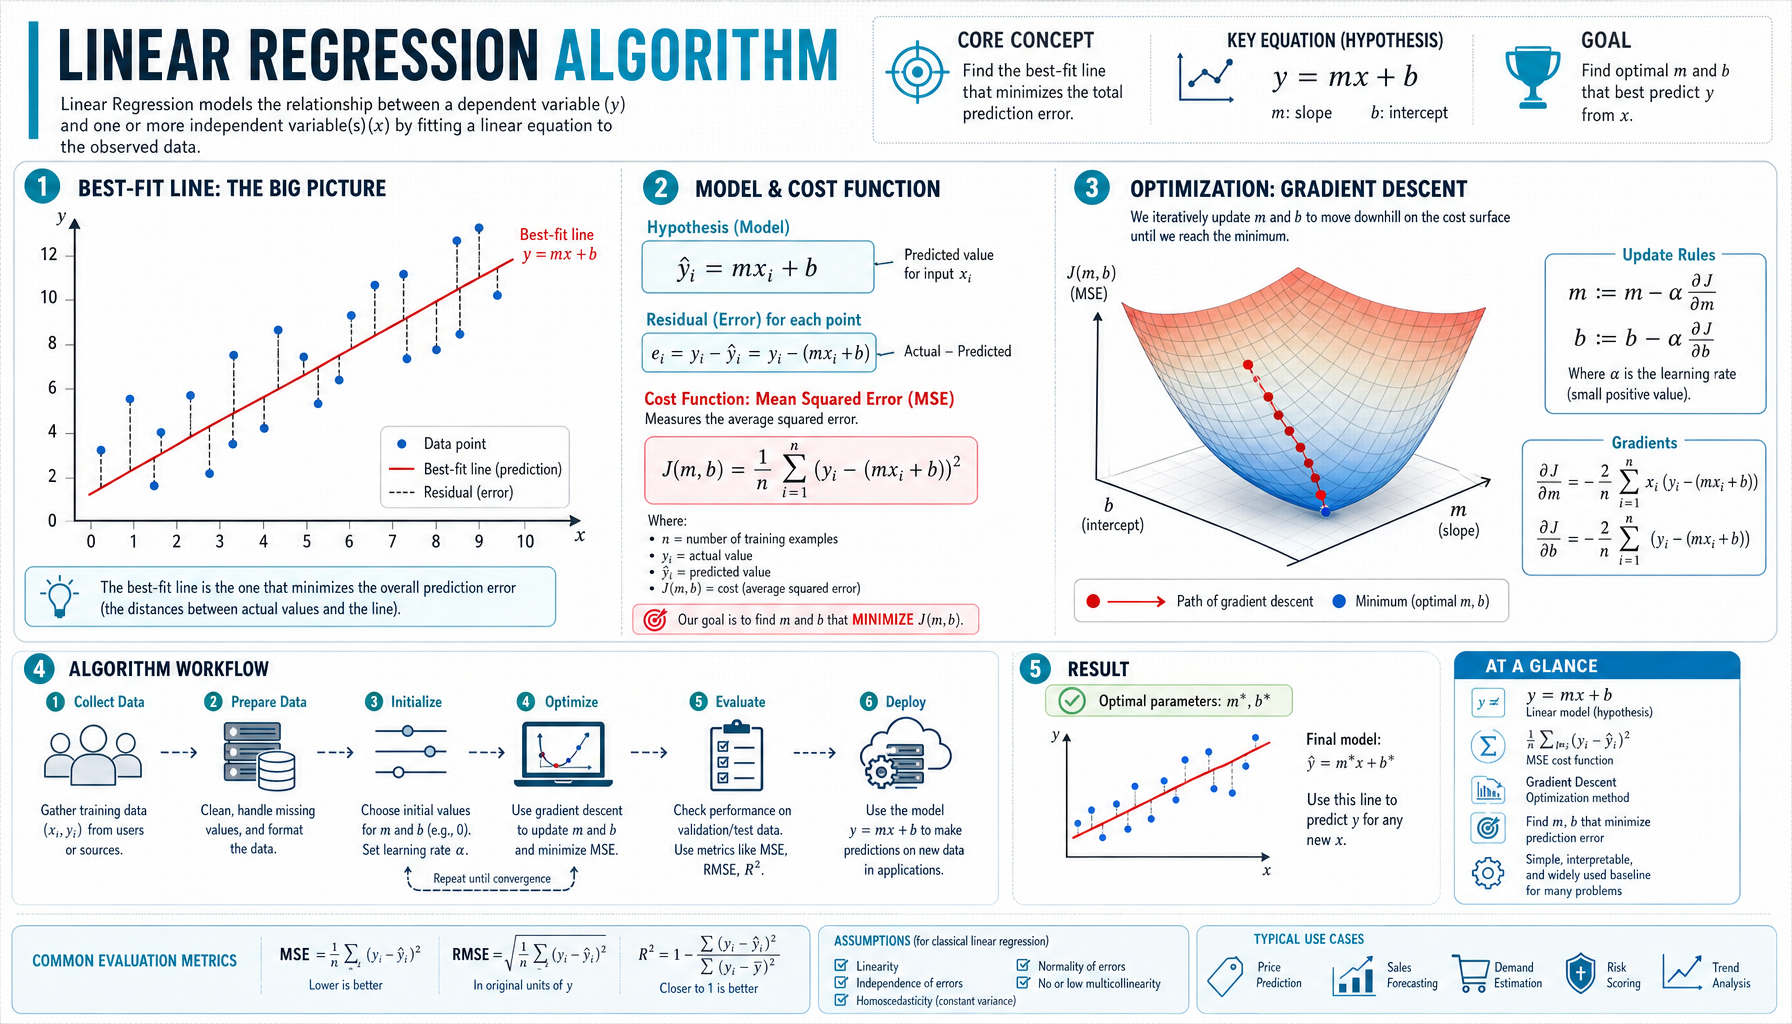
Linear Regression predicts continuous values (like house prices, temperatures, or sales figures) by finding the best-fit line through your data points.
#1 in 30 AI Algorithms
Linear Regression
The Best-Fit Line Finder
Linear
Regression
Regression
1
What It Does
🧍♂️ ⟷ 📈
🎯 Mental Model: Rubber band through points
→ Minimizes total distance from all points
→ Minimizes total distance from all points
• Input: Features (x)
• Output: Continuous prediction (ŷ)
• Goal: Minimize error
• Output: Continuous prediction (ŷ)
• Goal: Minimize error
2
The Cost Function
How we measure "best fit"
Mean Squared Error (MSE) measures the average squared distance between predictions and actual values.
Mean Squared Error (MSE) measures the average squared distance between predictions and actual values.
J(θ) = (1/2m) Σ(hθ(x⁽ⁱ⁾) - y⁽ⁱ⁾)²
Squared distances summed and averaged
Why squared?
• Penalizes large errors more heavily
• Makes the math tractable (smooth, differentiable)
• Penalizes large errors more heavily
• Makes the math tractable (smooth, differentiable)
3
Two Solution Paths
Direct calculation vs iterative optimization
📐 Normal Equation
θ = (XTX)⁻¹XTy
✓ Exact algebraic solution
✓ One computation, done
✗ Slow for large datasets
(matrix inversion is expensive)
✓ One computation, done
✗ Slow for large datasets
(matrix inversion is expensive)
⛰️ Gradient Descent
θ := θ - α∇J(θ)
✓ Iterative steps downhill
✓ Scales to large datasets
⚠️ Requires tuning α
(learning rate)
✓ Scales to large datasets
⚠️ Requires tuning α
(learning rate)
Choose based on dataset size
4
Feature Scaling Matters
Normalize inputs for better performance
Features on different scales distort the cost function. Example: square footage (1000-5000) vs number of rooms (1-5).
Without scaling, gradient descent takes tiny steps in one direction and huge steps in another — slow convergence!
Features on different scales distort the cost function. Example: square footage (1000-5000) vs number of rooms (1-5).
Without scaling, gradient descent takes tiny steps in one direction and huge steps in another — slow convergence!
🐌
Unscaled
Slow zigzag path
🚀
Scaled
Direct path
💡 Always normalize features!
Solution: Normalize to similar ranges (e.g., mean=0, std=1)
Solution: Normalize to similar ranges (e.g., mean=0, std=1)
5
When to Use Linear Regression
Know your algorithm's strengths
✓ Use when:
- Predicting continuous values
- Expecting roughly linear relationships
- Need interpretable model
- Creating baseline before complex models
✗ Avoid when:
- Output is categorical (use classifiers)
- Highly non-linear relationships
- Need to capture complex interactions
Decision flow:
Continuous output? → ✅ Linear Regression
Categorical output? → 🔄 Use classifier
Non-linear? → 🔧 Add polynomial features
Continuous output? → ✅ Linear Regression
Categorical output? → 🔄 Use classifier
Non-linear? → 🔧 Add polynomial features
Checkpoint Questions
Test your understanding — try answering before moving to the next algorithm
Question 1:
Can you derive the normal equation from the cost function?
💭 Hint: Take derivative of J(θ), set to zero, solve for θ
Question 2:
Why minimize squared error instead of absolute error?
💭 Hint: Think about differentiability and outlier sensitivity
Question 3:
What happens when features aren't scaled?
💭 Hint: Visualize the cost function contours