🔗 Builds on Algorithm #1: Linear Regression
Algorithm #1: y = w·x + b (unbounded)
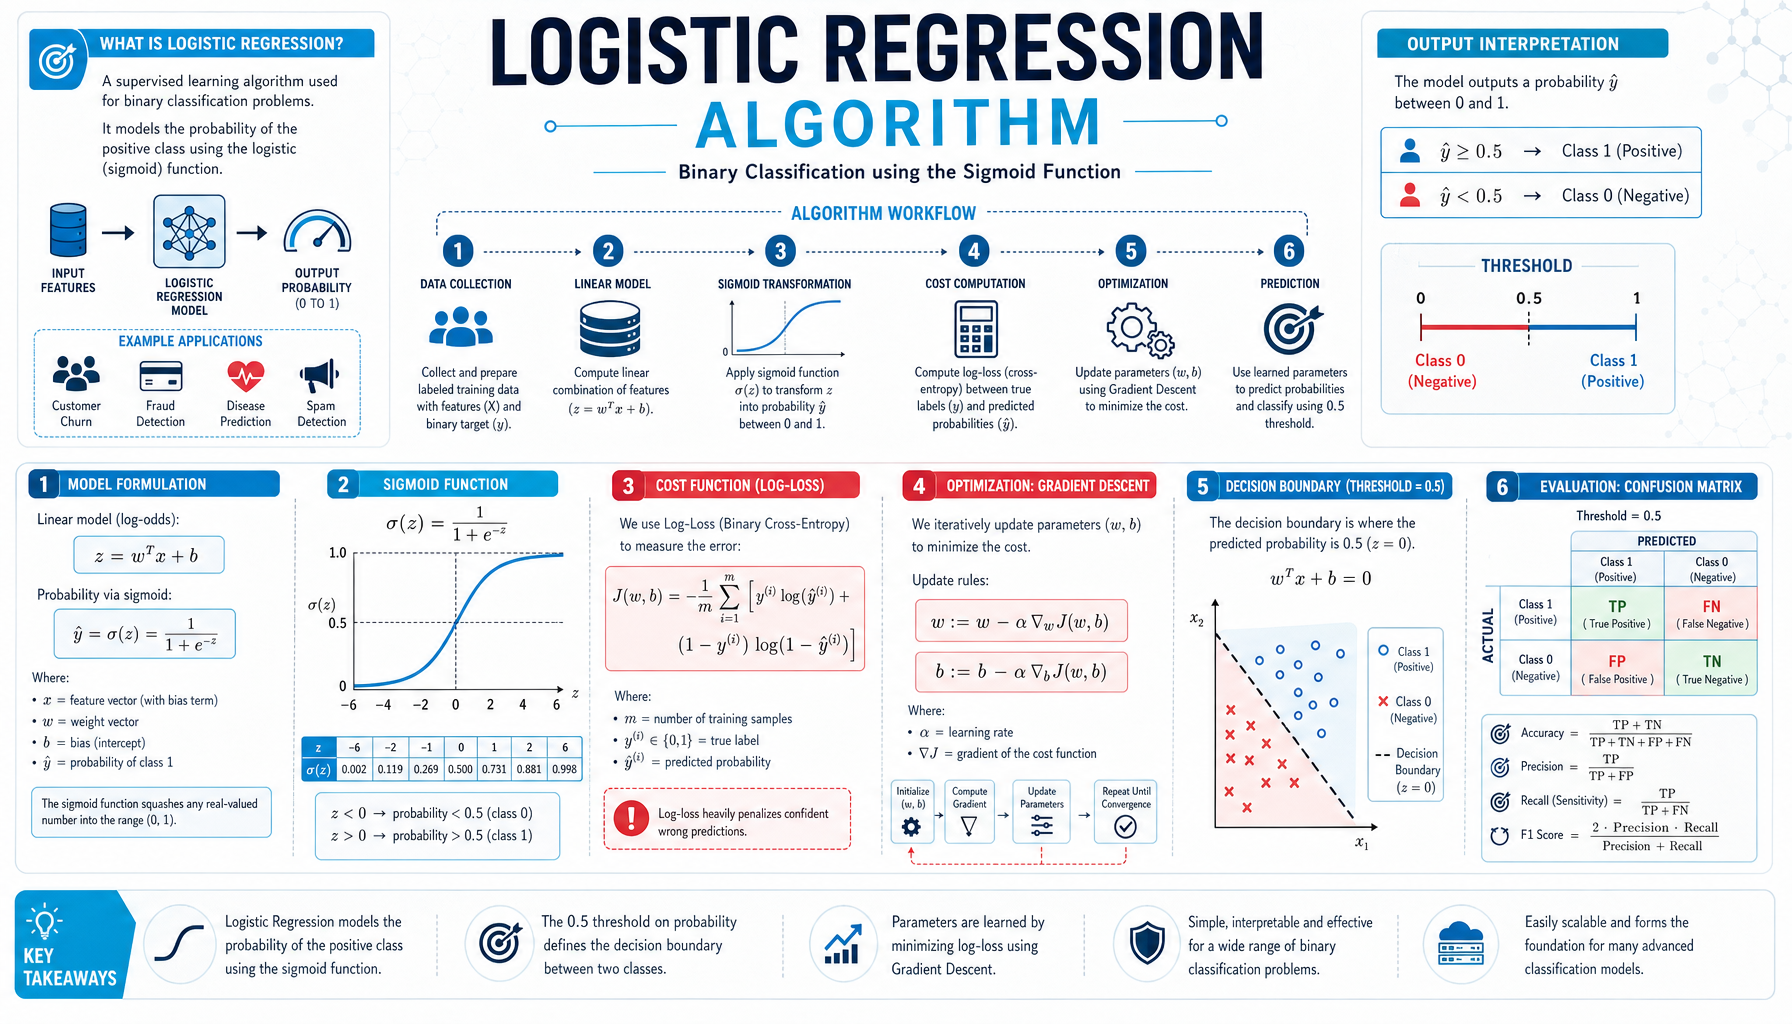
Algorithm #2: p = σ(w·x + b) (bounded [0,1])
Same linear model, different output transformation!
Logistic
Regression
Linear + Sigmoid
→ [0, 1]
Sigmoid Activation
Maps any real number to [0,1]
Output: probability of class 1
Ex: 0.73 → 73% class 1
Decision Boundary
Occurs when z = 0
Line: w·x + b = 0
Separates class 1 from class 0
Log Loss
Classification loss function
Also called: cross-entropy
Penalizes confident errors heavily
Applications
• Spam detection
• Disease diagnosis
• Any binary classification
• Plot decision boundaries
✓ Test Your Understanding
Q1: Why can't we use linear regression for classification?
Linear regression produces unbounded values (can be negative or > 1). Classification needs probabilities [0,1]. Also, squared error treats all errors equally, but we need different loss for classification.
Q2: What does sigmoid output represent?
The probability that input belongs to positive class (class 1). Example: σ(z) = 0.73 means 73% probability of class 1, 27% of class 0.
Q3: How does the decision boundary work?
It's where p = 0.5, occurring when z = 0. Geometrically: the hyperplane w·x + b = 0. Points on one side predict class 1, other side predicts class 0.