PHASE 4 · DIMENSIONALITY REDUCTION · ALGORITHM 14/30
🎯 Principal Component Analysis
Compressing high-dimensional data while keeping what matters most
💡 Core Concept
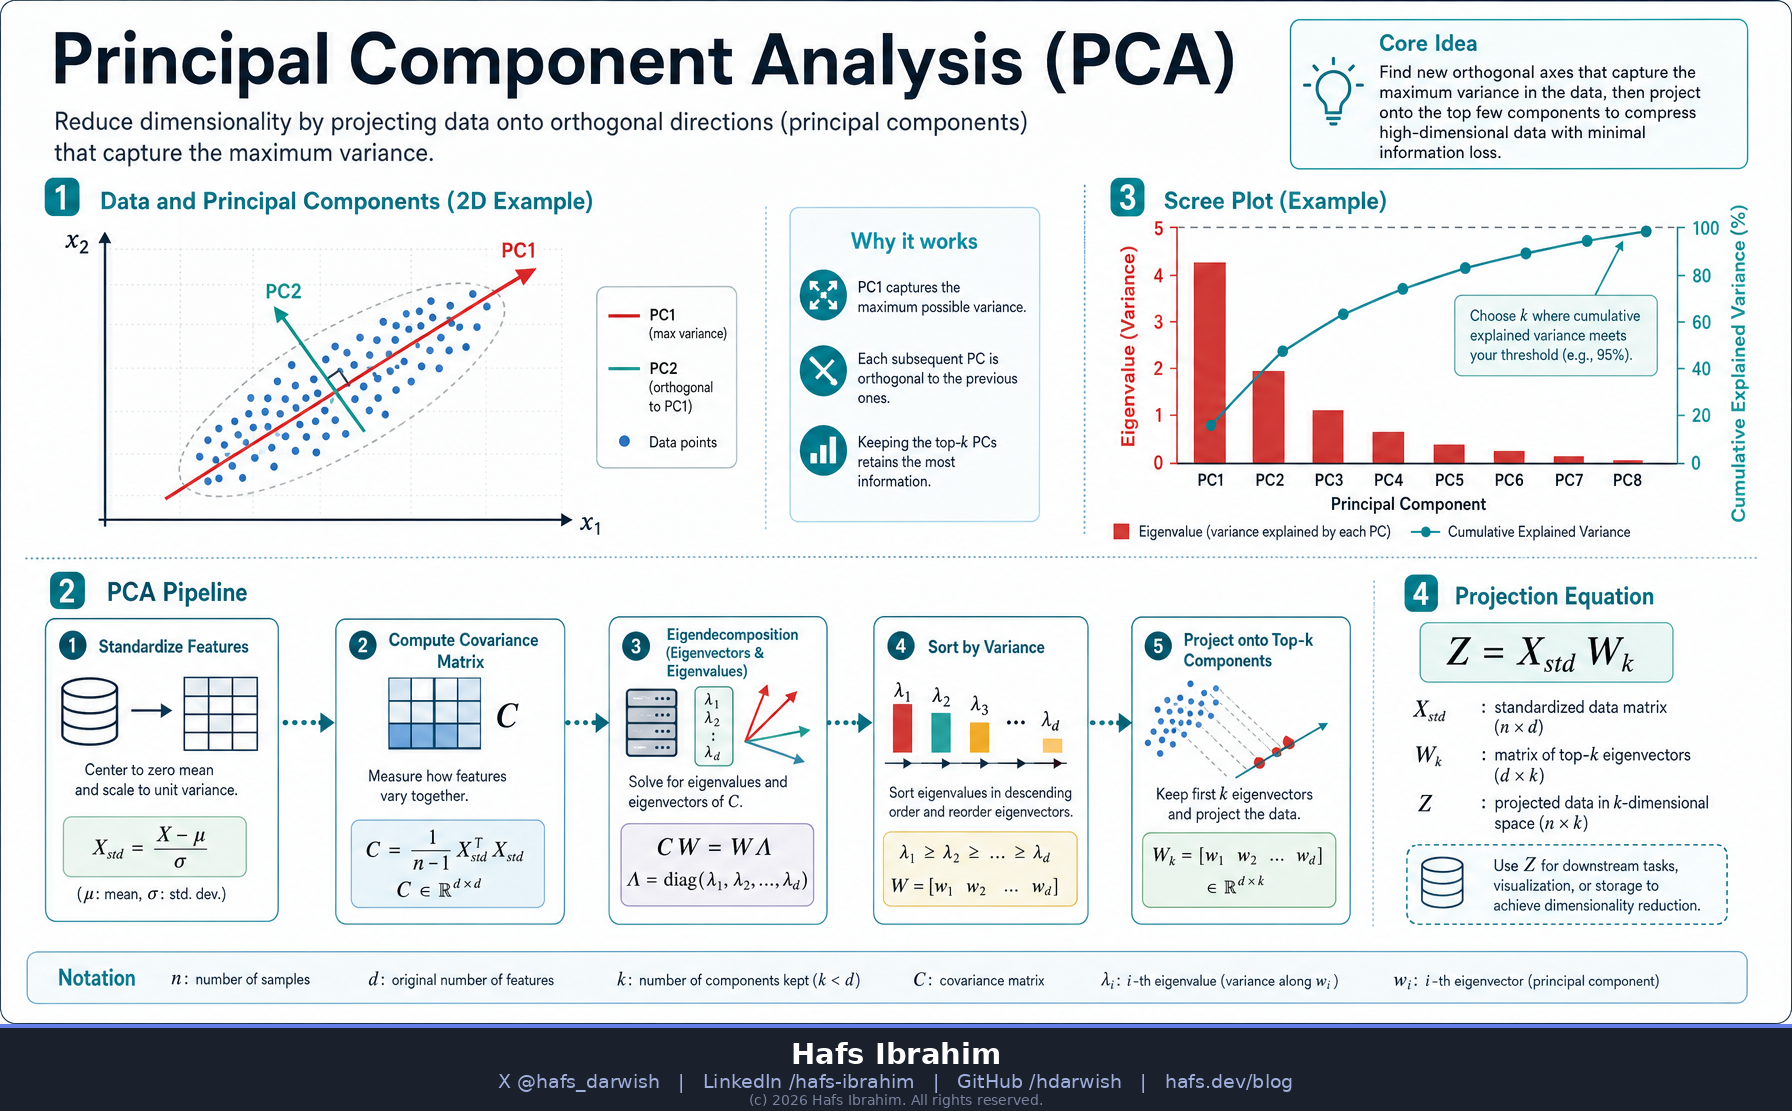
PCA finds a new set of orthogonal axes — the principal components —
ordered so the first captures the most variance in the data, the second the next most, and so on.
By projecting your data onto just the top few components, you compress many correlated features
into a handful of uncorrelated ones with minimal loss of information.
Mental model: Imagine photographing a 3D cloud of points. PCA rotates you to the
camera angle where the cloud looks widest — that viewpoint preserves the most structure
when you flatten it to a 2D photo. The “widest spread” direction is PC1.
🔑 Key Components
Variance = Signal
PCA assumes directions of high variance carry the important structure; low-variance directions are treated as noise and discarded.Covariance Matrix
Encodes how features co-vary. Its eigenvectors point along the principal component directions; eigenvalues measure variance along each.Orthogonality
Every component is perpendicular to the others, so the new features are uncorrelated — no redundant information across axes.Explained Variance
The scree plot shows how much variance each PC captures. Keep enough PCs to cover, say, 90% of total variance.⚙️ How It Works
- Standardize each feature to zero mean and unit variance (scale matters — PCA is scale-sensitive).
- Compute the covariance matrix of the standardized data.
- Eigendecomposition (or SVD): find eigenvectors & eigenvalues.
- Sort eigenvectors by descending eigenvalue — largest variance first.
- Project data onto the top-k eigenvectors to get the reduced representation.
Z = X · Wₖ
🌎 Real-World Applications
Image compression
Eigenfaces / face recognition
Gene expression analysis
Noise reduction
Visualizing high-dim data (2D/3D)
Feature de-correlation before ML
Finance: factor extraction
🧪 Checkpoint Questions
1. Why must you standardize features before running PCA?
Hint: think about what happens if one feature is in millimeters and another in kilometers — which dominates the variance?
2. PCA reduces dimensions but the new components are often hard to interpret. Why, and when is that an acceptable trade-off?
Hint: each PC is a linear combination of all original features — consider prediction accuracy vs. explainability.
3. How would you decide how many principal components to keep?
Hint: look at the cumulative explained-variance curve and the “elbow” of the scree plot.