Phase 4 · Algorithm 15 of 30
t-SNE
t-Distributed Stochastic Neighbor Embedding · Dimensionality Reduction & Visualization
💡Core Concept
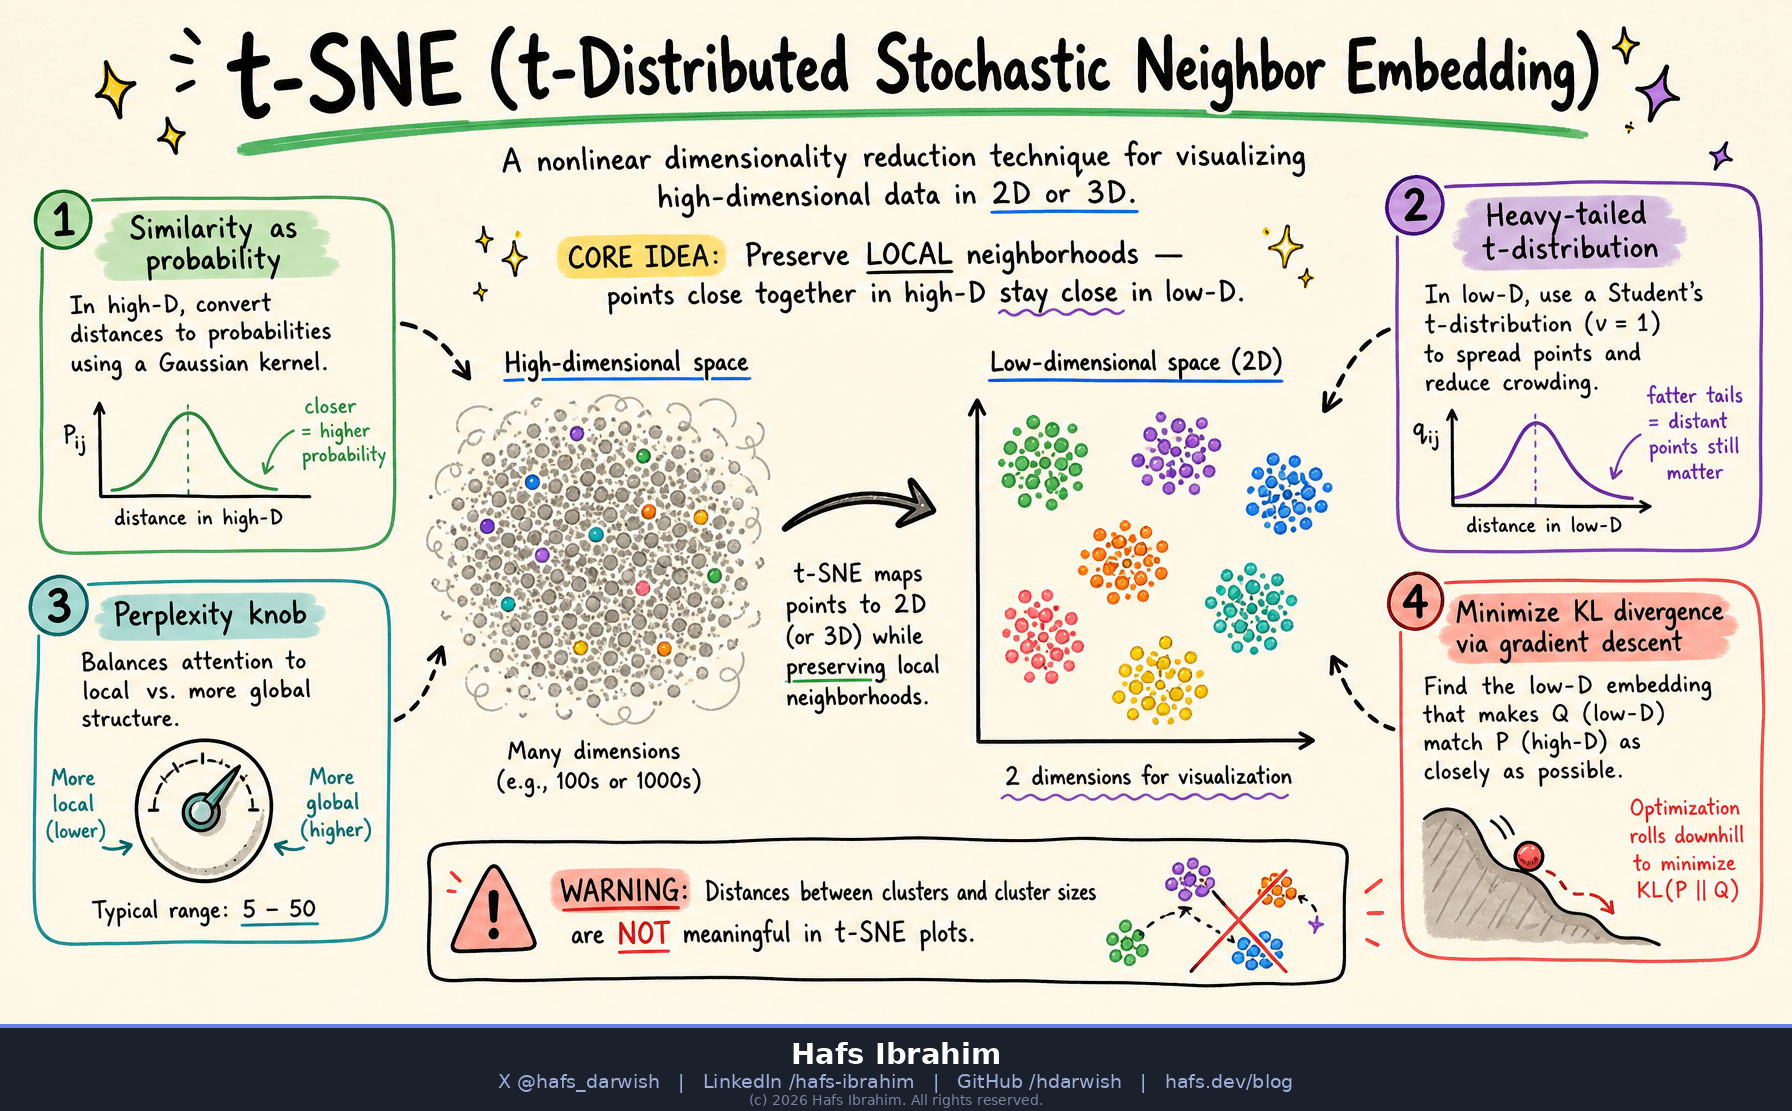
t-SNE takes high-dimensional data (think hundreds of features) and squeezes it into 2D or 3D so you can see it. Its one obsession: keep neighbors together. Points that are similar in high-D land close in the map; the global layout is sacrificed to preserve local structure faithfully.
🧩Key Components
Pairwise Similarities
High-D closeness modeled as a Gaussian probability — how likely point i picks j as a neighbor.
Student-t Kernel
Low-D uses a heavy-tailed t-distribution to relieve crowding and spread clusters apart.
Perplexity
The key knob (≈5–50). Balances attention to local vs. broader neighborhoods.
KL Divergence
The loss. Gradient descent nudges the map until high-D and low-D similarities agree.
⚙️How It Works
- Compute pairwise similarities in high-D using Gaussian kernels (width set by perplexity).
- Randomly scatter points in the low-D map.
- Compute low-D similarities with the Student-t kernel (heavy tails).
- Measure the mismatch as KL divergence between the two similarity distributions.
- Move points via gradient descent to shrink that mismatch — clusters emerge.
⚠️ Read the map carefully: distances between clusters and cluster sizes are not reliable. t-SNE preserves who's near whom, not how far apart groups truly are.
🌍Real-World Applications
Single-cell RNA clusters
Word / image embeddings
MNIST digit maps
Anomaly exploration
Neural feature inspection
✅Checkpoint Questions
Why does t-SNE use a heavy-tailed t-distribution in the low-dimensional space instead of another Gaussian?
What does the perplexity parameter control, and what happens if you set it too low or too high?
Your t-SNE plot shows two clusters far apart. Why is it a mistake to conclude those groups are "very different"?