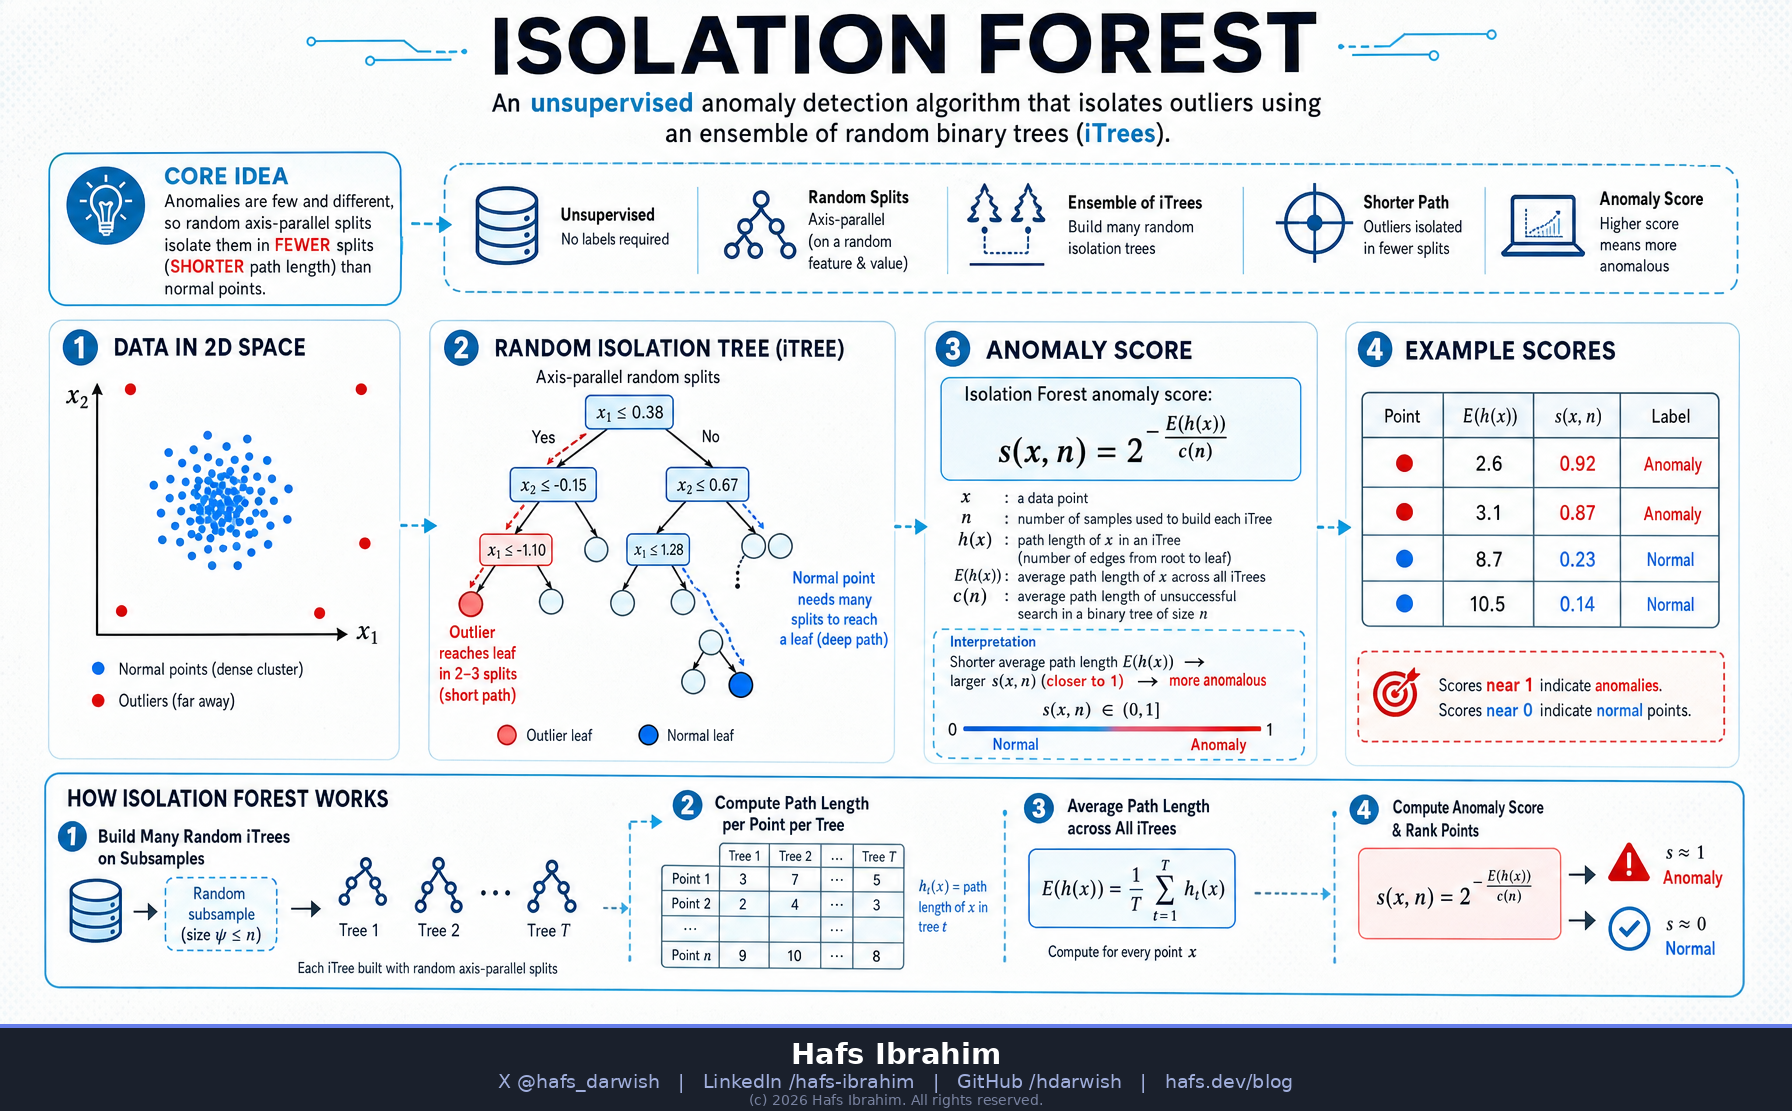
Isolation Forest
Finding outliers by how quickly they can be isolated
💡Core Concept
Anomalies are few and different. Isolation Forest builds an ensemble of
random binary trees that split data on random features at random thresholds.
Because outliers sit apart from the crowd, a few random cuts isolate them —
so they land at shallow leaves with short path lengths. Normal points,
buried in dense regions, need many splits to isolate. Short average path = anomaly.
🧩Key Components
Random SplittingPick a random feature & a random split value between its min and max — no distance metric needed.
Path Length h(x)Number of edges from root to the leaf that isolates a point. The core anomaly signal.
Ensemble of iTreesMany trees on random subsamples; average path length across trees stabilizes the score.
Distribution-FreeNo assumption of Gaussian/clusters. Works on high-dim, mixed data out of the box.
⚙️How It Works
- Draw a random subsample; build an isolation tree by recursively picking a random feature and random split until points are isolated or max depth is hit.
- Repeat to grow a forest of many independent iTrees.
- For each point, measure its path length in every tree and average it: E(h(x)).
- Convert to an anomaly score — shorter average path ⇒ score closer to 1.
s(x, n) = 2−E(h(x)) / c(n)
s → 1 : likely anomaly · s → 0.5 : normal · c(n) normalizes for sample size
🌍Real-World Applications
- 💳 Credit-card & payment fraud detection
- 🖧 Network intrusion & cybersecurity monitoring
- 🏭 Predictive maintenance — sensor / equipment fault alerts
- 🩺 Medical outlier screening & lab-result anomalies
🎯Checkpoint
Why are anomalies easier to isolate than normal points?
How does path length translate into an anomaly score — and why average it over many trees?
Contrast Isolation Forest with DBSCAN: when would you reach for each on the same outlier task?